See who really joined in
The event statistics count replies, uploads and reactions for you – before the party the planning status, afterwards who was there and what went down best.
Counts along. You just look.
Replies, uploads and reactions are counted in the event anyway – the statistics put them in order, before and after the party.
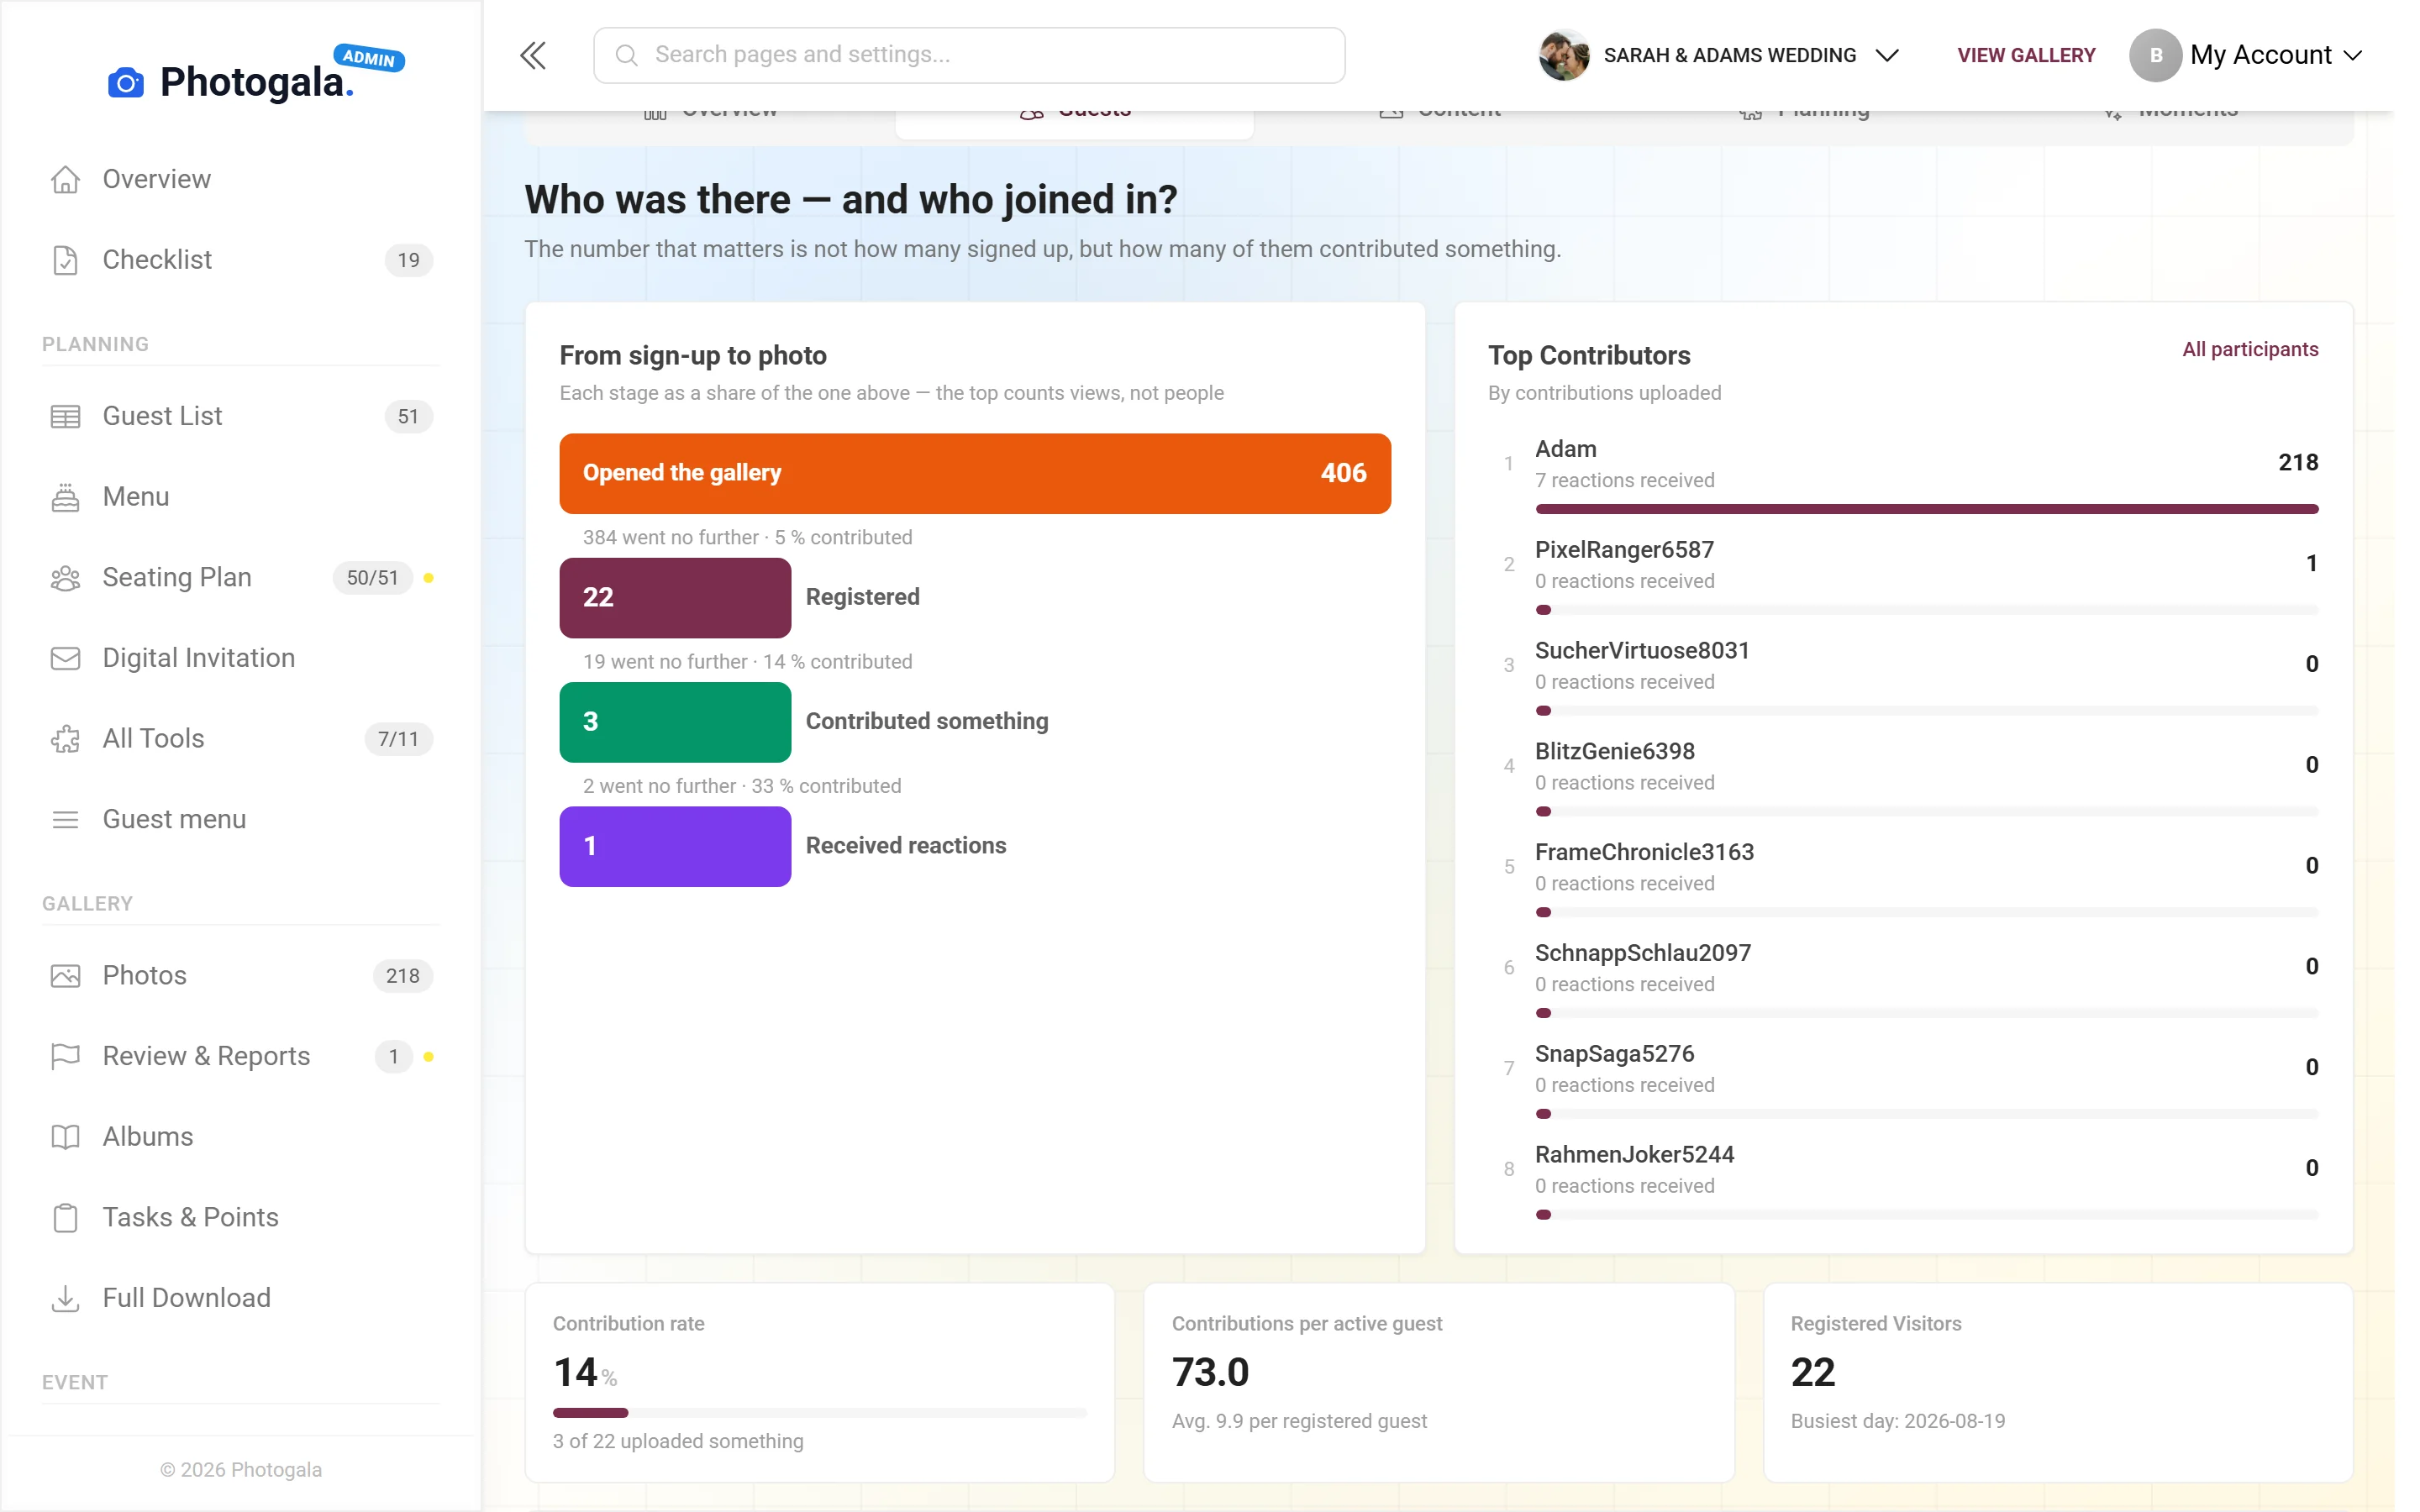
How many opened the gallery, registered and actually contributed something.
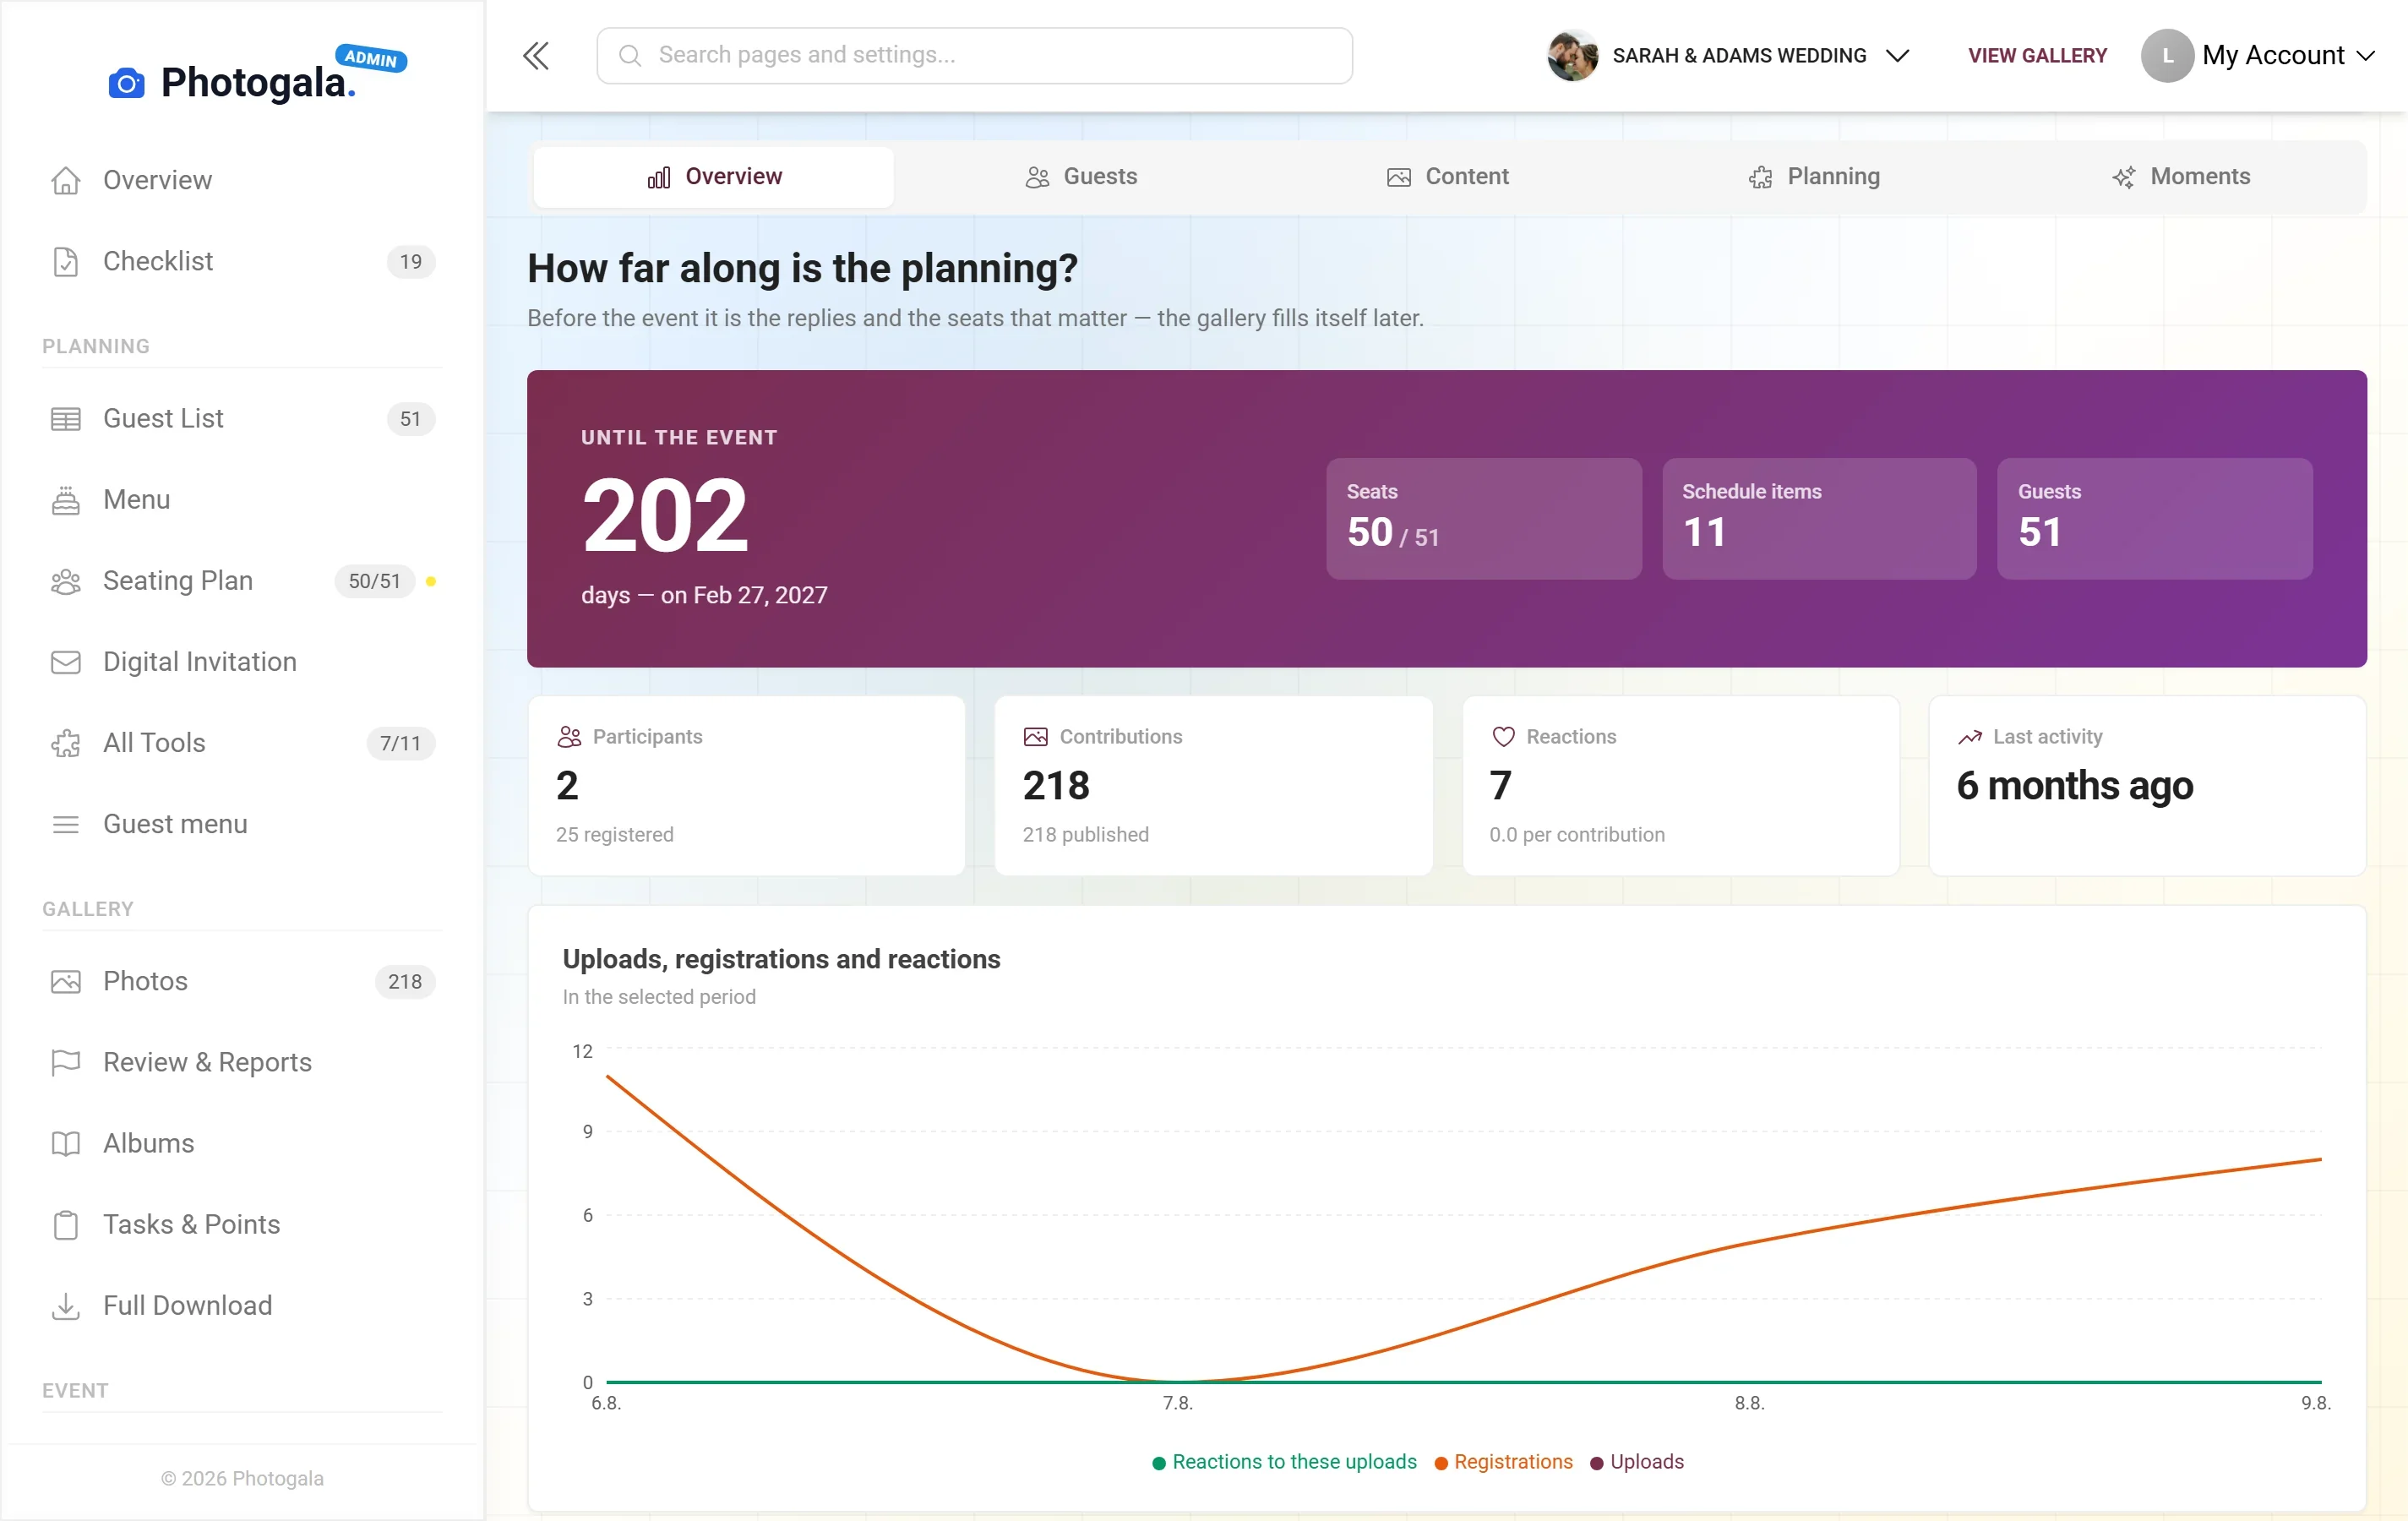
Days until the party, seats taken, schedule items – the status at a glance.
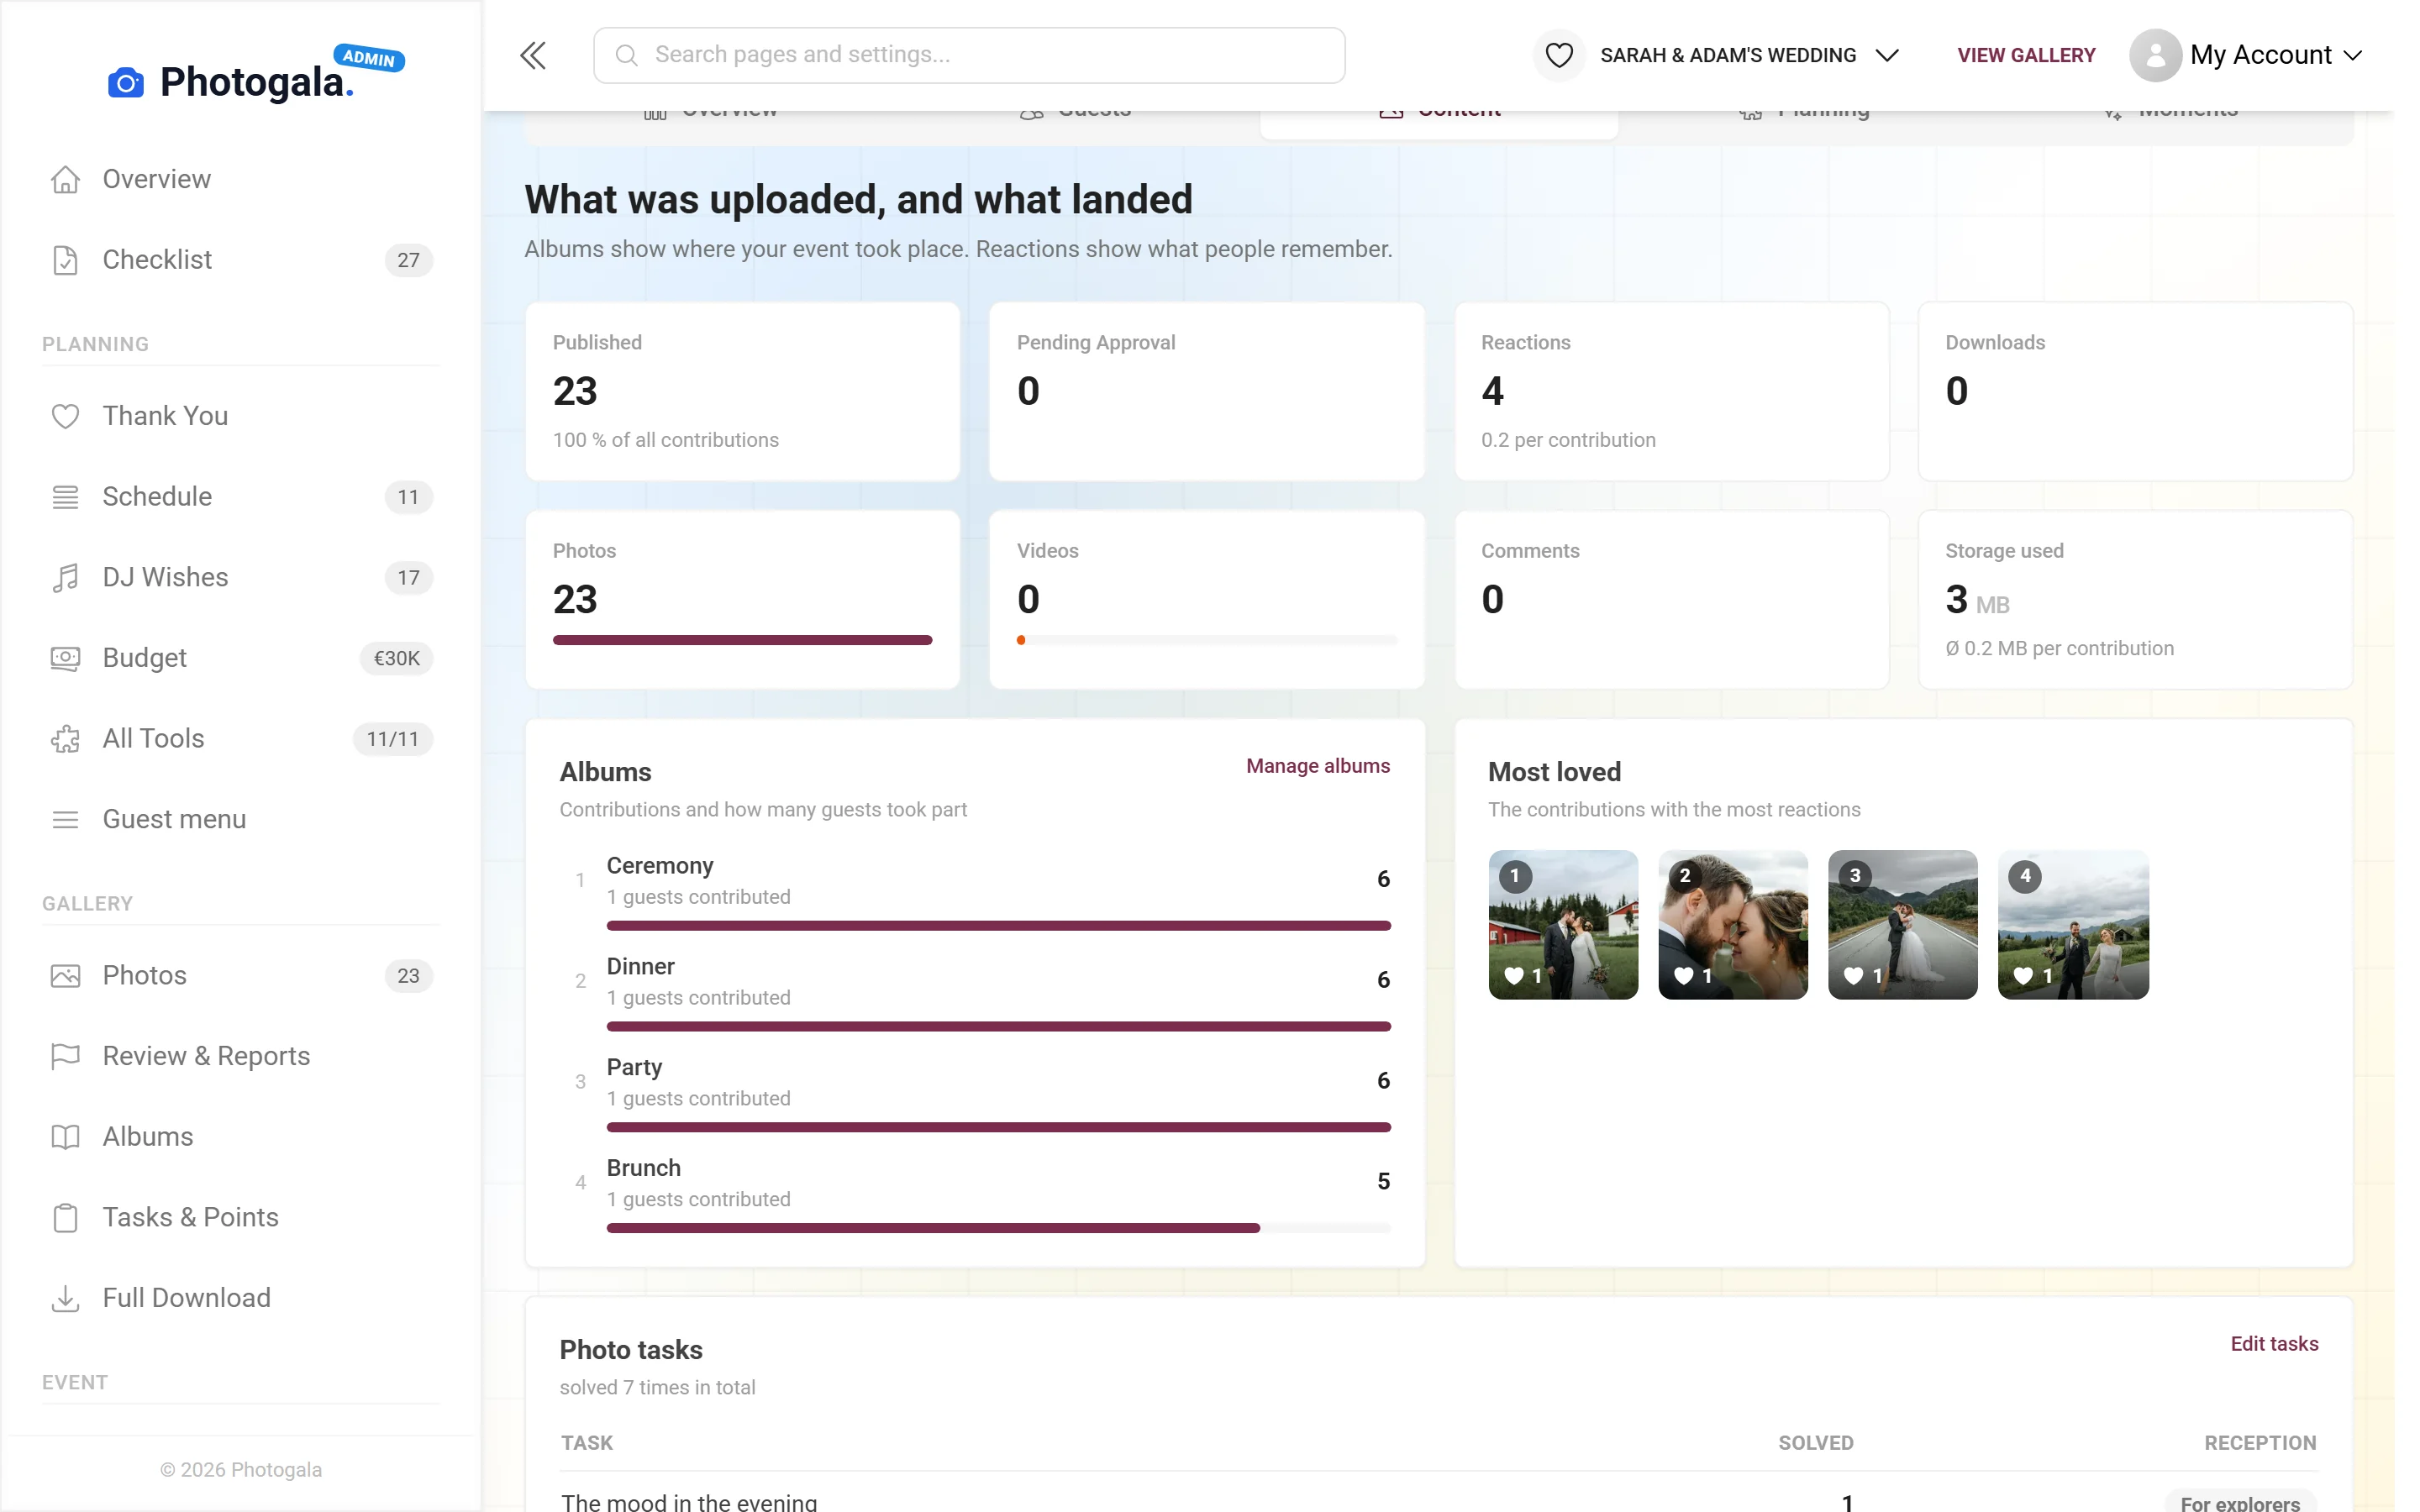
Albums, most-liked posts, photo tasks – and when the evening was busiest.
Included in every event, no setup · visible only to you and your moderators
Ask a question. The statistics answer.
A rebuild of the statistics page with example values from a wedding with 80 guests. Pick a question and the matching tab opens.
- Five areas: Overview, Guests, Content, Planning, Moments
- Period on automatic or chosen yourself – from one day to a custom range
- Refresh with one click whenever you want the latest numbers







How many guests actually joined in?
Free
Event Statistics is included in every plan — the free one too.
Create your event for free – the statistics count from day one, no setup needed.
- No App Required
- Setup in 5 Minutes
- 30-Day Money Back
Numbers that say something about the evening
- 1Who it's forHosts and planners – before, during and after
- 2What happensFive areas show RSVPs, uploads and moments
- 3In the endA clear picture of who really took part
More details
Statistics sounds like a quarterly report, but here it means something else: how many guests actually joined in? Which photo challenge worked and which one was ignored? When was the evening at its liveliest?
That is why the view changes with the phase of your event. Before the party it shows something different from the day after — and you never have to work out which number matters right now.
- Weddings
- Corporate events
- Birthdays
- Event planners
Everything built in
- State of the repliesAlways current, outstanding answers included
- ParticipationYou can see how many guests really contributed
- Peaks of the eveningUpload activity over time
- Reusing itFeeds straight into the recap
Statistics questions
1Can guests see these numbers?
2Do I have to set anything up?
3Is personal data analyzed?
4Why do I see different areas before the party?
5Does it update during the party?
6Can I export the numbers?
7How long do the analyses stay available?
8Do the statistics cost extra?
Goes well with
Ready to Get Started?
Create your event in minutes. No credit card required.